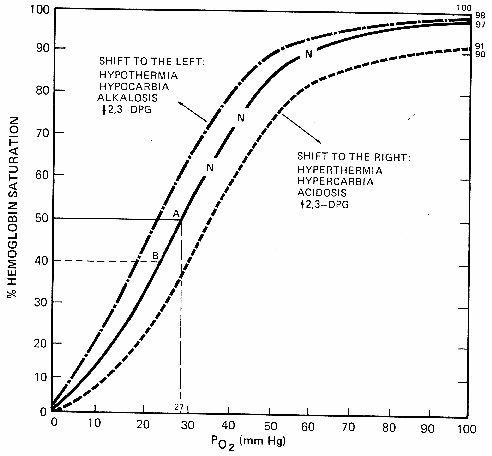
Oxyhemoglobin dissociation curve. N=normal curve; A=hemoglobin 50% saturated with O2; B=hemoglobin bound tightly with O2, refusing to release the O2 to the tissues, leading to hypoxia.
Oxyhemoglobin Dissociation Curve

Oxyhemoglobin dissociation curve. N=normal curve; A=hemoglobin 50%
saturated with O2; B=hemoglobin bound tightly with O2,
refusing to release the O2 to the tissues, leading to hypoxia.
A shift to the right will occur in acidosis, hypercarbia, increased carbon dioxide, and fever. As one can tell from the change in the normal slope to the slope of a right shift, the arterial oxygen tension and hemoglobin saturation are less than the normal curve. This means that there is less oxygen content of the blood; however, it also means that the hemoglobin will more readily give oxygen up to the tissues, preventing hypoxia. Physiologically, this is an advantage only within certain limits. If the shift is not returned toward normal, eventually the decreased oxygen content will not prevent tissue hypoxia. If the oxygen is not there, it simply does not matter how easily hemoglobin gives it up.
A shift of the curve to the left occurs in alkalosis, hypocarbia, and hypothermia. Not on the graph above that the arterial oxygen tension and hemoglobin saturation are only very slightly changed from the normal curve. In a shift to the left, hemoglobin binds oxygen much more tightly and releases less oxygen to the tissues.
The amount of oxygen dissolved in the plasma provides the "driving pressure" that forces oxygen to combine with hemoglobin. The dissolved oxygen is directly proportional to its partial pressure and is termed the arterial oxygen tension. The driving pressure of dissolved oxygen exists until the alveolar (PAO2) and the arterial (PaO2) pressures are almost equal. The oxygen pressure gradient between the alveolus and the erythrocyte is now almost in equilibrium. This is the point of the normal curve in the upper right the above graph. In the normal healthy person, the oxygen tension is 95 to 97 mmHg with a hemoglobin saturation (SaO2) of about 97%.