Physiology II
Respiratory Physiology and Pathophysiology
Analysis of Hypoxemia Cases
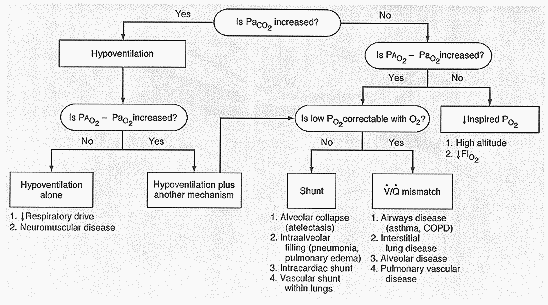
Students are encouraged to review the cases provided with the
handouts, fill in the spaces in the chart below with data provided in the case
or with values calculated from the data provided, and then use the flow chart
provided to determine the pathophysiological mechanism(s) contributing to
arterial hypoxemia in each case.
|
Cases
|
FIO2 |
PAO2 |
PaO2 |
PaCO2 |
A-a O2
difference |
 FIO2
FIO2
helpful?
|
|
Resp. Case A
a 76-year-old woman with dyspnea |
21%
|
63
|
60 |
69 |
3  |
No |
|
Resp. Case B
a 63-year-old woman with dyspnea
and severe chest pain over the left side |
30%
|
181.4
|
64 |
26 |
118  |
No |
|
Resp. Case C
a 49-year-old man with breathlessness
during even moderate activity |
21%
|
75
|
44 |
60 |
31  |
-- |
| 100%
|
626
|
290 |
70 |
336   |
Yes |
|
Resp. Case D
a 21-year-old high-altitude native
(sampled on mountain) |
84 mmHg
@ pressure 446 mmHg
|
50
|
48 |
27 |
2  |
Yes |
|
Resp. Case E
a 59-year-old man with shortness of breath |
21%
|
70
|
42 |
64 |
28  |
-- |
| 30%
|
101
|
56 |
90 |
45   |
No |

Sorry For the bad scan...It is a scan of a scan...You should get the idea
though.
Last Updated 09/06/01 08:53:27 PM
Return To The MNA 2001 Homepage
